Showing posts with label Silverlight. Show all posts

Saturday, August 1, 2009

Isometric Tile Hit Testing (Part 2)

And so from part one of the same article we knew how a given tile centroid in screen coordinates P(x,y) is mapped to the corresponding tile in map coordinates M(x,y). It is relatively easier to find the nearest centroid from the mouse cursor position, and here's how.

When user clicks anywhere on the canvas, mouse cursor position is captured relative to the top-left corner of the canvas. The nearest columns of dots to the left and right of cursor position are referred to as "left band" and "right band" respectively (click to enlarge):
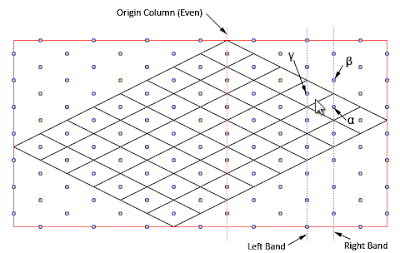


The left and right bands can be computed as follow:


double half_canvas_width = canvas_width * 0.5;
double click_x = mouse_x - half_canvas_width - offset;

int factor_x = (int)Math.Floor(click_x / half_tile_width);
int left_band_x = factor_x * half_tile_width;
int right_band_x = (factor_x + 1) * half_tile_width;


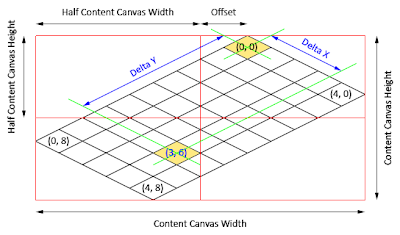
Variable offset represents difference between the tip of origin tile M(0,0) and the middle-top of the Content Canvas. Value of offset is zero for square maps, but not for rectangular ones (see Isometric Tile Positioning on Canvas for more details on offset):

Now determine the "even column" between these two bands: the "origin column", and every alternate column are "even columns". For the above case, the "right band" is an even column, while the "left band" is an odd column.

Next, try to identify two neighbouring points on the even column (right band in this scenario), referred to as beta and alpha points (as illustrated in above image):

double click_y = mouse_y - half_tile_height;
int factor_y = (int)Math.Floor(click_y / tile_height);
int beta_y = factor_y * tile_height;
int alpha_y = (factor_y + 1) * tile_height;

After both alpha and beta points are identified, find out which one is closer to click_y (for this case it is alpha point).

Gamma point is vertically centered between alpha and beta points, located across on the odd column. The key to identifying the clicked tile lies on finding the smallest distance from mouse position to either alpha or gamma points.
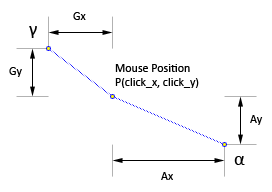

If Gx+Gy is smaller than Ax+Ay, then gamma point is clicked, otherwise alpha point is clicked.

Friday, July 31, 2009

Isometric Tile Hit Testing (Part 1)

As each of the tiles on Content Canvas is being represented by an Image object (essentially an UIElement), we could easily attach a MouseLeftButtonDown event handler to those images, and determine which tile is clicked. But then again, there may be hundreds of Image objects in the canvas that are visible at the same time. Hit-testing these objects as mouse cursor moves across the canvas require some processing, even Silverlight employs some kind of space partitioning techniques (I'm sure it does).

So wouldn't it be nice if we could just turn IsHitTestVisible property of every tile to false and skip all those processing altogether? It turns out we can take advantage of the fact that tiles are laid out in a uniform way, and translate a given mouse cursor position to a point in map coordinates.

Illustrated below is a rectangular map enclosed in a Content Canvas (which has red borders). The centroid of each tile is represented by a dot. These dots extended beyond the boundaries of map to illustrate their column and row nature (click to enlarge):


The origin tile has a map coordinates of M(0,0) and is always positioned at the top of the Content Canvas. All alternate columns of dots, starting from the origin tile are referred to as "even columns", while every other columns are "odd columns".

For the ease of calculation, we fix the centroid of the origin tile M(0,0) to have pixel coordinates of P(0,0), and all other tiles are placed relative to the origin tile. Assuming each tile is of size 64x32 pixels, centroids of other tiles on map would have the pixel coordinates as shown in image below (click to enlarge):

Let's try to derive the equations for mapping a screen coordinate P(x,y) to map coordinate M(x,y). From two of the highlighted cells above, we know that P(32,48) maps to tile M(2,1); and P(64,128) maps to tile M(5,3). That gives the following equations:

P(32,48) = M(2,1) --- Equation 1
P(64,128) = M(5,3) --- Equation 2

We know that both x and y screen coordinates have an influence on each x and y components in map coordinates. Let us first determine the influence P(x,y) has on the x component of map coordinates. From Equation 1 and 2 we know that:

32P + 48Q = 2 --- Equation 3
64P + 128Q = 5 --- Equation 4

Solving Equation 3 and 4 together we get:

P = 1/64
Q = 1/32

Now we do the same for y component of map coordinates:

32R + 48S = 1 --- Equation 5
64R + 128S = 3 --- Equation 6

Solving both Equation 5 and 6 we get:

R = -1/64
S = 1/32

Here are the final equations to map a screen coordinate P(x,y) to map coordinate M(x,y):

M(x) = P(x)/64 + P(y)/32
M(y) = P(y)/32 - P(x)/64

WARNING:
These equations are derived based on the assumption that tile height (e.g. 32) is half of the tile width (e.g. 64), where the above equation can be generalized in the following form:

M(x) = P(x)/Wt + P(y)/Ht
M(y) = P(y)/Ht - P(x)/Wt

where Wt is represents the tile width and Ht is the tile height.

How do we know it is correct? Well you can try it on another highlighted cell P(-96,144) and see if it maps correctly to M(3,6).

That is all about mapping a tile centroid in screen coordinates P(x,y) to cell in map coordinates M(x,y). In part two of this article, we will find way to identify the clicked centroid from a given mouse coordinate.

Thursday, July 30, 2009

Isometric Tile Positioning on Canvas

In order to avoid moving tiles on the Content Canvas completely, the Content Canvas is created big enough to accommodate the entire map. For those who think too much about performance like me, a Silverlight canvas can be created in different sizes without costing more (or less) memory, even when CacheMode is set to BitmapCache.

A square map (that has the same number of columns as the number of rows) will have its origin tile M(0,0) positioned in the exact middle-top of the canvas. But a rectangular map (that has number of columns not equal to the number of rows) will have its origin tile M(0,0) located some distance off the canvas center point (click to enlarge):


Since square maps are special cases of rectangular maps, we will attempt to solve the equations for rectangular maps as a generic solution. Let us use the following symbols to denote various components for calculation:


  • C = Number of columns on map

  • R = Number of rows on map

  • O = Offset from canvas center point

  • Wc = Canvas width in pixels

  • Hc = Canvas height in pixels

  • Wt = Tile width in pixels

  • Ht = Tile height in pixels


Based on observation, one additional row will increase the overall map dimension by Wt*0.5 pixels. This increment will offset origin tile M(0,0) by Wt*0.25 pixels to the right. Hence, offset from canvas center point O can be derived from the following equation:

O = (R-C) * Wt * 0.25


Again, based on the same observation, the canvas dimension can be obtained from the following equations:

Wc = (R+C) * Wt * 0.5
Hc = (R+C) * Ht * 0.5


Each tile on the map is represented by an Image object, whose first pixel lies on the top-left corner of the tile. A tile is positioned in the canvas at a location denoted by P(x,y), with respect to the top-left corner of the canvas. We can determine the values of P(x,y) for a given map tile M(x,y) with the following equations:

P(x) = O + [[M(x)-M(y)-1] * Wt * 0.5
P(y) = [[M(x)+M(y)] * Ht * 0.5